Quickly compare QA scores by Reviewer or Agent Group
The Coach Reviews heat-map previously only broke scores down by individual agent. It can now be grouped by reviewer or

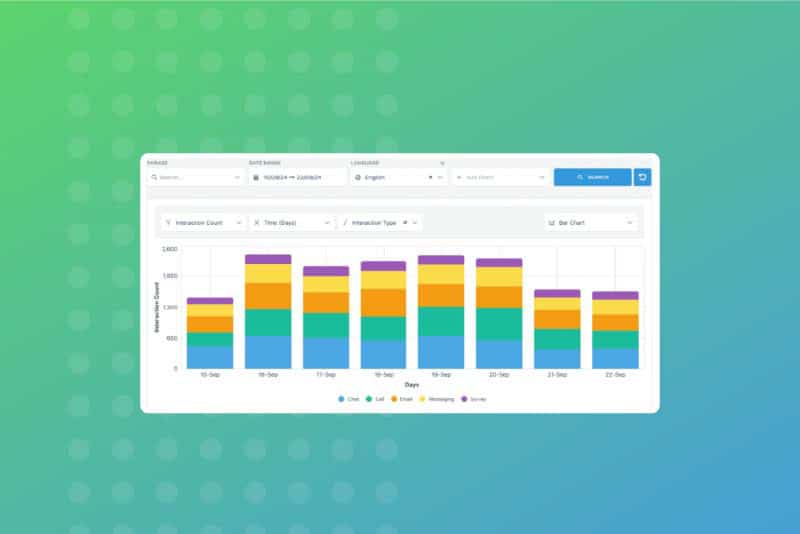
Our new custom charts feature offers a dynamic and efficient way to visualise customer insights, allowing users to easily explore their data in real-time. Gone are the days of exporting data, uploading it to external tools, and manually creating graphs.
Which agents are improving? Who’s falling behind? Do you need more support for a certain language? Knowing answers to questions like these can be the key to managing a successful customer support operation, but the process to get there – exporting data, uploading to an external system, and creating tables and graphs – takes up too much of your valuable time.
Now, you can create meaningful visualisations directly within EdgeTier, saving time and providing clarity to make the most data-driven decisions possible.
Charts that display valuable customer insights aren’t a new feature for EdgeTier. We’ve always prioritised data visualisation.
In the previous version, the main chart on the Explore page focused on interaction volume, allowing you to see how many conversations occurred based on the filters you’ve applied, which could be adjusted according to what you were searching for. The chart was automatically populated using a mix of the customer data we pull from your source system, such as a CRM, with the added layer of EdgeTier’s proprietary features that pull valuable insights, such as emotions and experience score metrics. Additionally, the interactions that correlate with the search – and chart – results populate below.
Now, we’re taking this concept a step further to make your interaction data even more impactful.
Key Benefits:
Log in to your EdgeTier account to check out this new release live in the system.
The Coach Reviews heat-map previously only broke scores down by individual agent. It can now be grouped by reviewer or
Ask Spotlight is getting smarter and easier to share. Three updates are landing together.
Agents can now formally respond to reviews they disagree with, and QA teams have a structured way to manage and

Debbie Duggan
Contract Manager for Customer Solutions
"We thought at the time that we were putting the customer at the fore. We thought we were doing things right. But in hindsight, we really weren’t because we had no real-time insights whatsoever into customer issues."

Nick Brazitis
Global Customer Care Manager
"The anomaly feature is a game changer for us. It’s highly accurate and has helped us identify customer issues, agent errors, and even fraud that would have taken us longer to catch."

Vladimir Greavu
BBG Director of Customer Service
"I specifically liked the flexibility. I liked the can-do attitude. I always felt supported. There hasn’t been any single point in our journey where EdgeTier has said no."
Let us help your company go from reactive to proactive customer support.
Unlock AI Insights