New AgentQA Permissions: Expanded Agent Log-In and View all Reviews
We’ve added even more permissions-based features to enable a better AgentQA experience in WatchTower.

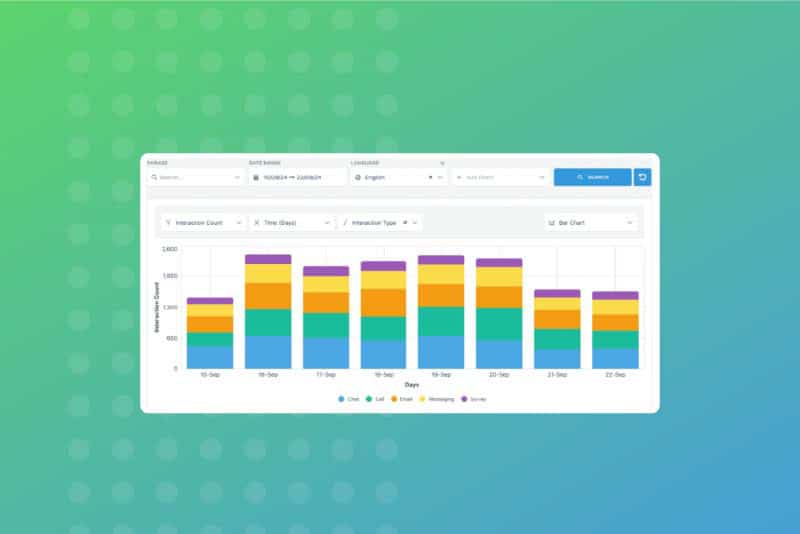
Our new custom charts feature offers a dynamic and efficient way to visualise customer insights, allowing users to easily explore their data in real-time. Gone are the days of exporting data, uploading it to external tools, and manually creating graphs.
Which agents are improving? Who’s falling behind? Do you need more support for a certain language? Knowing answers to questions like these can be the key to managing a successful customer support operation, but the process to get there – exporting data, uploading to an external system, and creating tables and graphs – takes up too much of your valuable time.
Now, you can create meaningful visualisations directly within EdgeTier, saving time and providing clarity to make the most data-driven decisions possible.
Charts that display valuable customer insights aren’t a new feature for EdgeTier. We’ve always prioritised data visualisation.
In the previous version, the main chart on the Explore page focused on interaction volume, allowing you to see how many conversations occurred based on the filters you’ve applied, which could be adjusted according to what you were searching for. The chart was automatically populated using a mix of the customer data we pull from your source system, such as a CRM, with the added layer of EdgeTier’s proprietary features that pull valuable insights, such as emotions and experience score metrics. Additionally, the interactions that correlate with the search – and chart – results populate below.
Now, we’re taking this concept a step further to make your interaction data even more impactful.
Key Benefits:
Log in to your EdgeTier account to check out this new release live in the system.
We’ve added even more permissions-based features to enable a better AgentQA experience in WatchTower.
Alongside other interaction analytics, our platform now provides you with resolution tags, to see how well support interactions are being
Strong Customer Emotions is a new widget on the Home screen that highlights the conversations where Frustration, Confusion, or Praise


Afroditi Pina
Director of Customer Service
"It has reduced the time for the quality assurance process as it provides clear data and a very robust direction on where to look and what matters the most."

Vladimir Greavu
BBG Director of Customer Service
"I specifically liked the flexibility. I liked the can-do attitude. I always felt supported. There hasn’t been any single point in our journey where EdgeTier has said no."

James Waghorn
Director of Customer Contact
"EdgeTier is no ordinary software product... It has completely changed how we work at CarTrawler."
Let us help your company go from reactive to proactive customer support.
Unlock AI Insights