iGaming Peak Season: Why Your Busiest Week Isn’t the Real Risk
iGaming's biggest threat isn't the Super Bowl or Cheltenham, it's the fact that anomalies never really stop. This piece breaks
Most customer operations don't have a data problem. They have a clarity problem. You track the essential metrics: volumes, AHT, CSAT, and resolution rates. Your dashboards are polished. Your QA is consistent. Your helpdesk is full of categories. Yet, the moment a spike hits or a metric dips, the room goes quiet. The same frantic…


Most customer operations don’t have a data problem. They have a clarity problem.
You track the essential metrics: volumes, AHT, CSAT, and resolution rates. Your dashboards are polished. Your QA is consistent. Your helpdesk is full of categories.
Yet, the moment a spike hits or a metric dips, the room goes quiet. The same frantic questions start flying:
That frustrating silence between having the data and actually understanding it is the Visibility Gap.
In our latest Customer Visibility Playbook, we break down how the world’s most efficient teams move from reactive “firefighting” to real-time, insight-driven operations. Below is a direct excerpt from that guide: a diagnostic tool to help you score your current maturity.
If you lead Support, CX, Ops, or Product, this is your reality check.
We’ve spoken with thousands of leaders, and the pattern is identical: most teams believe they understand their customers. Very few can prove it.
Support teams feel the friction daily:
Leadership feels the fallout:
Visibility only matters if it drives an outcome. When you can see why customers are reaching out in real time, you stop being a cost center and start being an intelligence engine.
How mature is your visibility today? For each category, pick the statement that honestly reflects your organization and note your score.
1pt – We don’t have a reliable view of contact reasons. Data is incomplete or inconsistent.
2pts – Support can identify issues, but insights are informal or hard to quantify.
3pts – We can analyse contact reasons, but it requires manual work or sampling.
4pts – We have a clear, automated, end-to-end view of all contact drivers.
1pt – It takes days or weeks to understand spikes or emerging issues.
2pts – We spot issues eventually, but often after escalations or complaints.
3pts – We can diagnose issues within a reasonable timeframe, but not in real time.
4pts – We see emerging issues as they happen and can intervene proactively.
1pt – Tagging is inconsistent or barely used. Data is not trusted.
2pts – Tagging exists, but reliability varies by agent, product, or region.
3pts – Tagging is mostly consistent, but still requires cleanup or interpretation.
4pts – Categorisation is automated, accurate, and multilingual across all channels.
1pt – Insights rely heavily on manual reading, coding, or ad hoc analysis.
2pts – Analysts can produce insights, but with significant manual effort.
3pts – Analysts automate some reporting but still spend time chasing data issues.
4pts – Analysts focus on strategic analysis because foundational insight is automated.
1pt – Different teams use different numbers. Insights are often disputed.
2pts – Support insights are acknowledged but rarely drive business decisions.
3pts – Teams use support insights, but adoption is inconsistent.
4pts – All teams rely on a shared, trusted understanding of customer issues.
1pt – Insights rarely influence product or process changes.
2pts – Some issues get escalated, but impact is unclear or anecdotal.
3pts – Insights influence decision-making, but not consistently or at scale.
4pts – Customer insights routinely drive roadmap decisions and proactive improvements.
6 to 10 points: Level 1 – Data Blind You are in a permanent state of reaction. Without reliable data, you are trapped answering the same avoidable questions while costs spiral.
11 to 16 points: Level 2 – Isolated Insights Your Support team knows what’s wrong, but the rest of the business isn’t listening. Your visibility lacks the structure and trust needed to drive real change.
17 to 21 points: Level 3 – Manual Mining This is where most modern teams get stuck. You know visibility matters, and you’re working hard for it, but the manual effort is a bottleneck. You’re getting the right answers, but they’re arriving too late to stop the fire.
22 to 24 points: Level 4 – Insight-Driven You have achieved high-fidelity, real-time visibility. Your Support team is an intelligence hub that identifies trends, reduces contact, and drives the product forward.

Improving your visibility isn’t a “one and done” project. It’s a progression.
If you landed at Level 1 or 2, you are likely paying a “hidden tax” on every customer interaction. If you are at Level 3, you are likely one step away from a major breakthrough in efficiency.
In the full Customer Visibility Playbook, we go deeper into the roadmap for scaling your operations, including:
Every customer conversation is a signal. Are you actually listening?

iGaming's biggest threat isn't the Super Bowl or Cheltenham, it's the fact that anomalies never really stop. This piece breaks
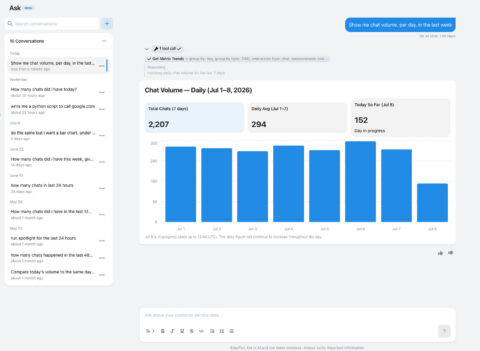
A behind-the-scenes look at building 'Ask Spotlight', our AI-powered feature that lets users query their data in natural language, covering
Every quarter, our team ships features designed to give you and your customer teams faster answers, cleaner workflows, and more

Quentin Bottner
Head of Continuous Improvement
"We’re a big business, so getting the right people to agree and fix something hasn’t always been easy. Now we’ve got one version of the truth—it’s much easier to align and act"

James Waghorn
Director of Customer Contact
"EdgeTier is no ordinary software product... It has completely changed how we work at CarTrawler."

Nick Brazitis
Global Customer Care Manager
"The anomaly feature is a game changer for us. It’s highly accurate and has helped us identify customer issues, agent errors, and even fraud that would have taken us longer to catch."
Let us help your company go from reactive to proactive customer support.
Unlock AI Insights